


SaaS Model
An easy tool to build intuition around SaaS metrics and model your startup


The Model
Honestly, when I started building YayPay in 2016, it was a challenge for me to understand clearly how the SaaS business works. It took me some time to get comfortable with it. And even now, after becoming an investor and mentor, I continue to learn new ways to look at the metrics of the SaaS business. If I'd a tool like this back then, it would have made my life much easier.
So, to help founders I advise, I've developed a SaaS Model that allows you to:
Build an intuition around SaaS metrics and how they're connected
Play with the numbers to see how they can be optimized
See the data on clear charts
Learn the industry guidelines and make changes to meet them
To start, you need to make a number of assumptions, such as:
The projected level of spending on R&D, Sales, G&A etc.
ACV
Churn Rate
Client Growth Rate
Based on these assumptions, the model calculates the company's performance for the next 2 years, which is presented as a series of more than 30 standard SaaS metrics:
Runway
Net Burn
Gross Margin (%)
S&M as % of Revenue
ARPU (MRR/Total Clients )
CAC
LTV/CAC
Burn / MRR
You can check the performance of this imaginary company in the detailed charts.
You can also review industry guidelines (e.g., LTV/CAC > 3, CAC Payback < 12m, etc.) and adjust the model accordingly until you find the one that might work for you.
I find this tool excellent for modeling potential business models for SaaS and seeing in advance where you might've problems in the future or what areas of the business you need to control the most.
Here is the MODEL LINK.
Example
The example you see in the model is based on a hypothetical company with the following parameters:
Let's assume that a simple accounting tool can be subscribed to at a price of 99$/month. After a year, when more features are added, we increase the price to $149/month.
We want to start building this business by investing $200K of their own money into the business.
Suppose the churn rate is 15%, but it drops to 10% over time
Assume they also receive $5 per new customer as service revenue
In the beginning, we spent $5K/mo on research and development, which increases over time to $15K
we spend $5K/mo on marketing, which increases over time to $30K a month
Let's also assume that manufacturing costs increase over time from $500 to $2,500 (e.g., server costs).
And the G&A Costs increase from $3K to $9K over 2 years. 9. And the customer base grows from 10 new customers per month to 75 - this is of course, the most important and uncertain assumption, but we've to start somewhere.
After putting all the numbers into the model, we see that a pretty depressing picture emerges because in month 9, we've no more money in the bank - the MRR growth cannot sustain the burn, and there's still a lot of time before we break even. See the chart below.

This problem can be solved by raising additional funds. Let's say we raise another $300,000 in month 7, let's see how that changes. As we can see, this time it looks much better, at least we're not going bankrupt.

However, if we look at another chart that shows the remaining term, a risky picture emerges, because we'll have to deal with a term of one month for quite a while.
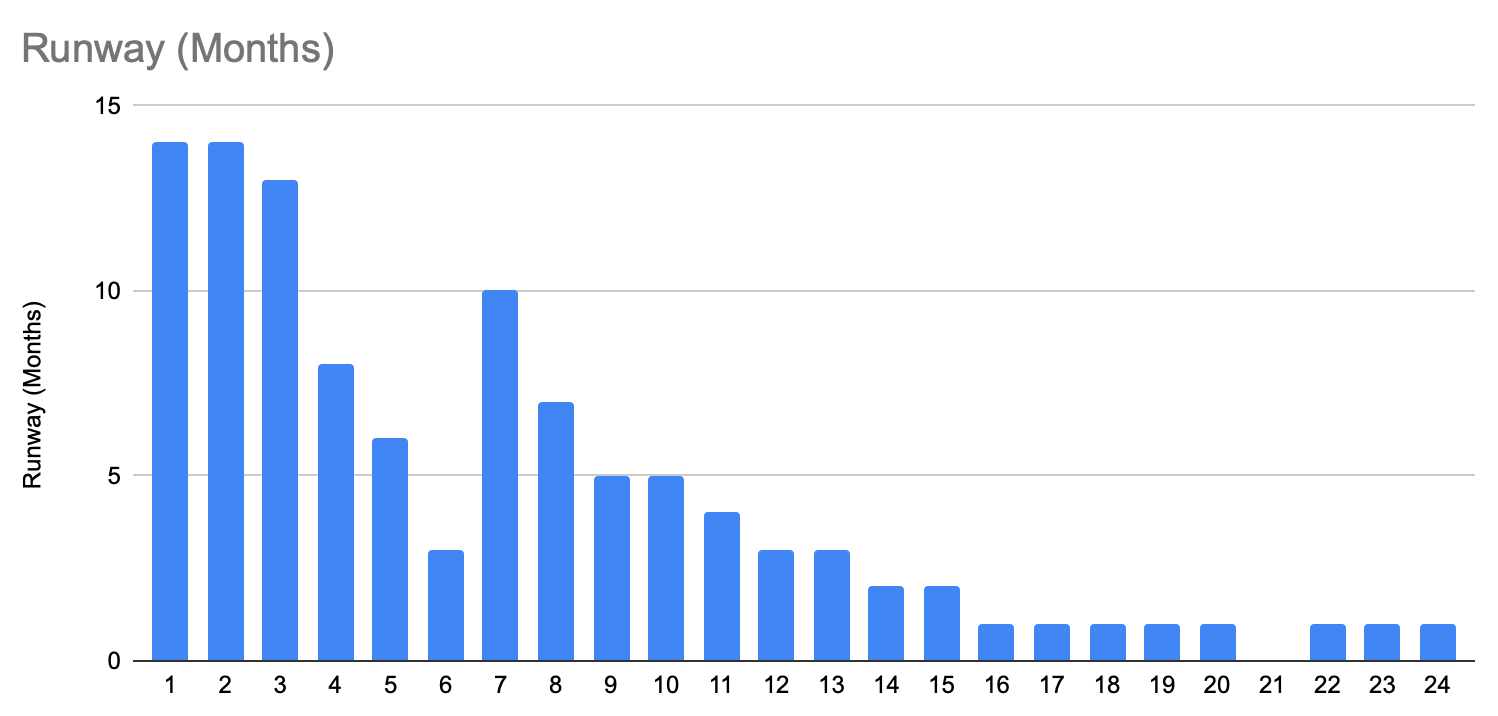
To avoid this risk, it might make sense to raise another $100,000 at the end of the first year, which works well in this case and allows us to safely cross the profitability threshold.
At the same time, in order to raise money in the future, we need to show the expected level of metrics.
The Gross margin seems pretty healthy if we can hit those numbers.

CAC Payback is high at the beginning but then normalizes to a decent value, well below the recommended 12 months.
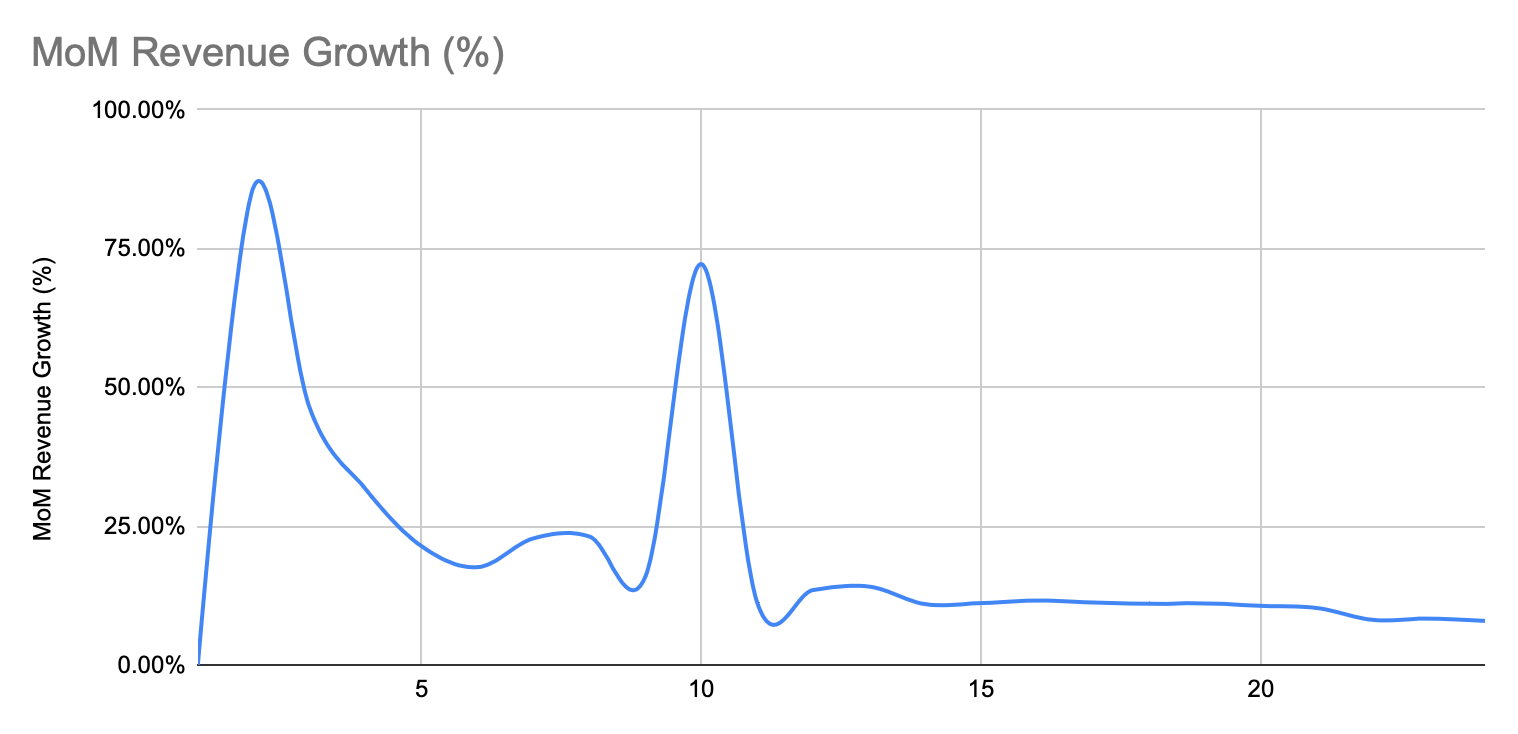
MoM revenue growth also looks pretty healthy at around 10% per month.
This time looks like it's working! Now comes the most challenging part - the actual implementation. In this case, the biggest challenge is ensuring we can achieve this growth rate with the assumed marketing spend. And, of course, we can maintain the churn rate, find a product-market fit, save money, and so on...
This tool is helpful for checking your ideas and assumptions about a future business, but of course, it's a simplification, and for each case, you need to add more specific details.
If you're relatively new to SaaS, I will encourage you to play with the numbers to better understand how much churn, R&D spend, and other assumptions impact results.
You're welcome :)